Running a self-service retail operation can be a bit like juggling — there are so many things to keep track of! But what if there was a tool that could make it a lot easier?
Seed Analytics is like having a super-smart assistant who breaks down what’s happening with your business and how to respond accordingly. For example, you can see which products are flying off the shelves and which ones are just sitting there. You can track the top ten spoiled products or see how your sales are doing week over week. You can even check product costs by branch or route and see if your drivers are collecting the right amount of money. All this information is right at your fingertips.
So, let’s dive into seven key Seed Analytics functionalities that can make your operation more efficient and profitable:
Fast Facts
- Real-time sales insights help you focus on best-selling items and adjust strategies for underperforming ones.
- The Spoilage dashboard highlights the most spoiled products and their costs, reducing waste.
- The Collections dashboard tracks driver performance, ensuring machines are properly stocked.
- The Machine Scheduling dashboard optimizes routes, reducing stop costs and improving efficiency.
1. Sales Performance
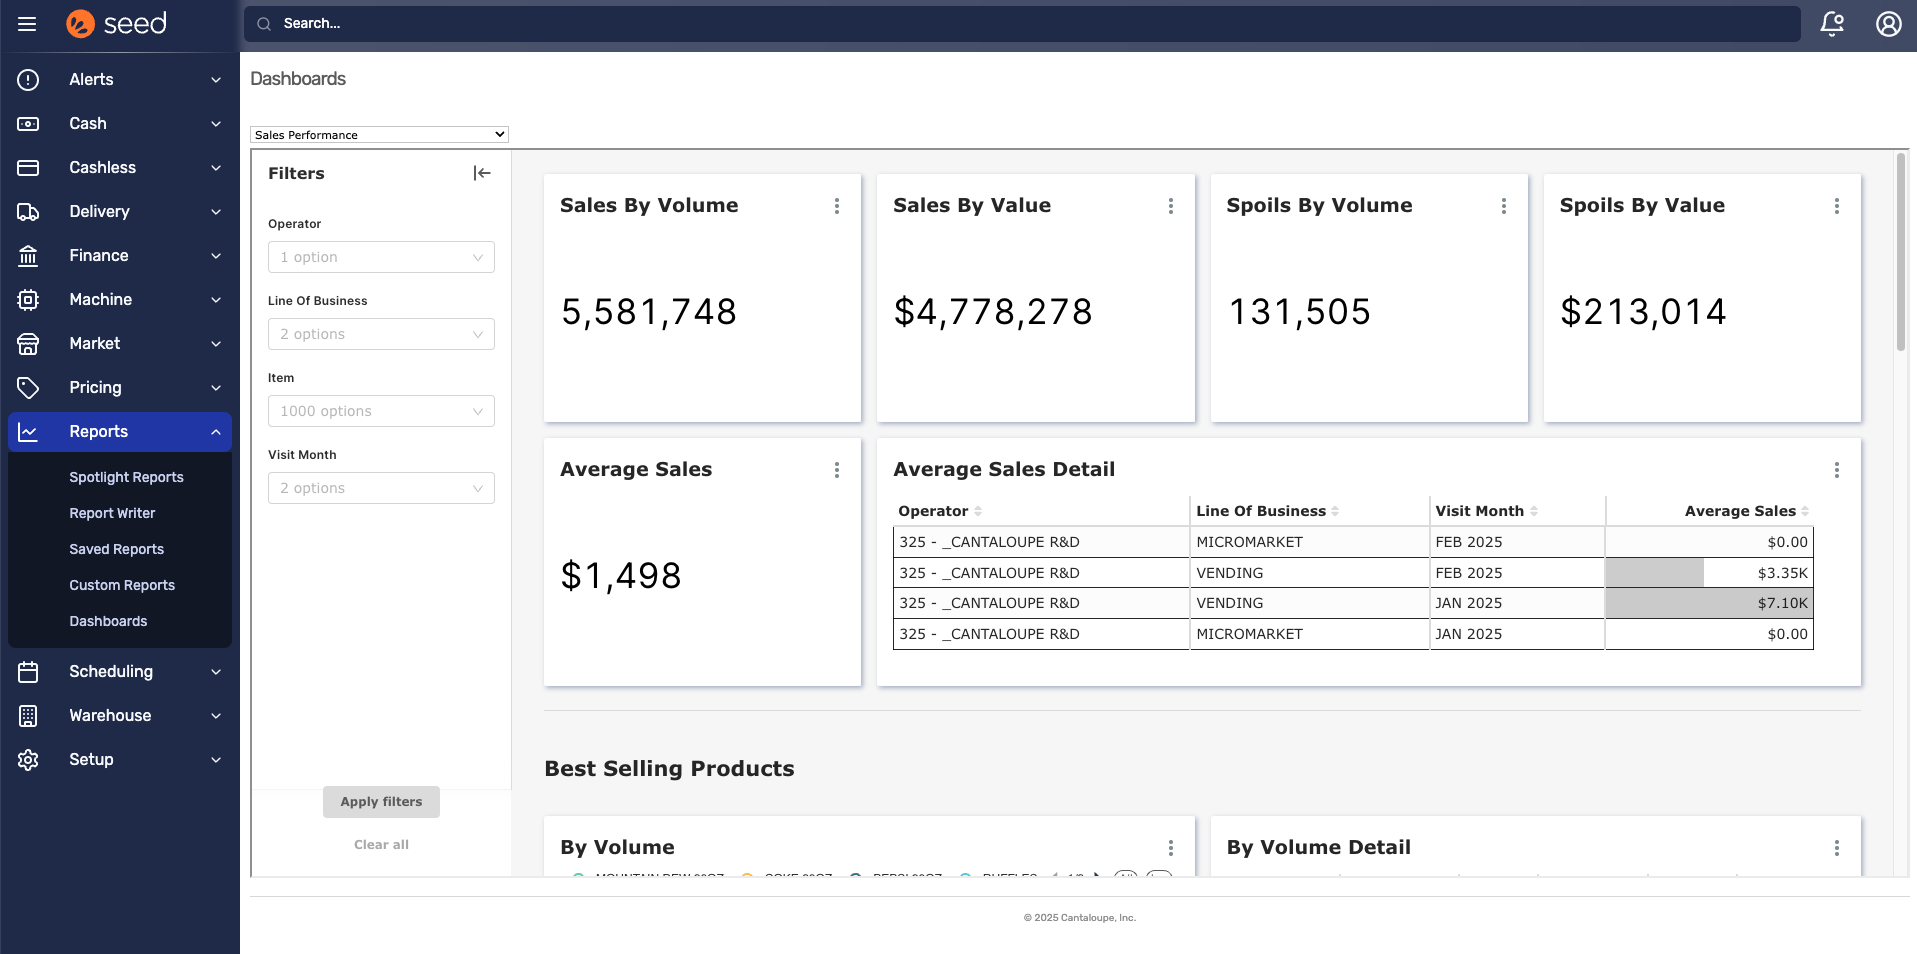
Understanding what’s selling and what’s not is crucial for your business. The Sales Performance section of the dashboard provides real-time insights and data visualizations that help you make informed decisions. You can see which products are the best sellers by volume and value, and track week-over-week sales totals.
This section also helps you identify trends and adjust your strategies accordingly. If a product is performing well in most locations but not in others, you can focus your attention on improving sales in the underperforming locations. By keeping a close eye on these metrics, you can optimize your product mix and maximize your revenue.
2. Spoilage
The Spoilage dashboard helps you reduce waste and improve operational efficiency. You can find it under the reports tab after enabling Analytics. This dashboard provides a high-level overview of spoilage costs per machine over time. It highlights the most often spoiled products and allows you to focus on specific assets with significant spoilage issues. For example, it can show you the spoilage cost for microwaveable meals and powdered donuts, and the specific machines where these products are slow to sell. The product spoilage summary at the bottom details the quantity and cost of spoilage for each location, helping you identify and address problems quickly.


3. Collections
The Collections dashboard is designed to ensure driver accountability. It allows you to filter by brand, branch, or line of business, such as hybrid routes. This dashboard provides metrics like the number of visits with depletions, average fills per machine as a percent of invalid inventory, and the number of out-of-stock or depleted items. This helps in identifying issues, such as drivers not refilling coins, and tracking trends over time. With the data in this dashboard, you can have informed conversations with your teams to address discrepancies and improve performance.
4. Machine Scheduling
Dynamic scheduling can significantly reduce stop costs and improve operational efficiency. The Machine Scheduling dashboard helps you understand the reasons behind adding or removing machines from your schedule. By aligning your scheduling criteria with your operational goals, you can avoid manual overrides, which often lead to inefficiencies and increased costs.
The dashboard provides a clear view of the impact of your scheduling decisions. For example, you can see the cost savings from making fewer trips to the same location by servicing multiple machines in a single visit. This not only reduces stop costs but also optimizes your routes, ensuring that your resources are used more effectively.
By effectively using the machine scheduling dashboard, you can maximize the days between service visits, reduce manual labor, and improve overall business performance.
5. Warehouse Inventory
Managing inventory effectively is crucial for reducing costs and maintaining accuracy. With the Warehouse Inventory dashboard, you can identify inventory discrepancies by consistently inventorying the top problematic items. This helps address issues like product theft or improper handling, reducing the need for full warehouse inventories. The dashboard allows filtering by warehouse and product type, providing insights into inventory values and potential cost savings. By regularly shoring up inventory, you can prevent larger discrepancies from accumulating over time.
6. Warehouse Receives
Tracking product quantities and unit costs is essential for effective warehouse management. The Warehouse Receives dashboard offers a detailed view of the number of units brought in, which can be filtered by supplier or product. This helps in identifying higher product costs from one supplier compared to another.
For example, if you’re buying chips from different suppliers, you can use the dashboard to see if there are significant differences in the unit costs from each supplier. This information aids in making informed decisions about purchasing and managing inventory costs effectively.


7. Replenishment
The replenishment process is a critical component of effective inventory management. The Replenishment dashboard plays a significant role in ensuring that inventory levels are maintained efficiently. The dashboard provides real-time insights and data visualizations that help you make informed decisions about restocking needs.
Key features of the Replenishment dashboard include:
- Best-Selling Products: Identify which products are the top sellers by volume and value. This information helps in ensuring that popular items are always in stock.
- Over/Short by Day and by Route: Track discrepancies in inventory to identify and address issues promptly. This helps in maintaining accurate stock levels and reducing waste.
- Week-Over-Week Sales Totals: Monitor sales trends to predict future demand and adjust inventory levels accordingly. This ensures that you are always prepared to meet customer needs.
This dashboard helps reduce stop costs and optimize routes by identifying which assets need to be serviced and when, based on depletion levels and other criteria. This dynamic approach ensures that you are making the most of your resources and avoiding unnecessary trips.
Use the power of analytics to improve your operation
Seed Analytics is a great tool that can help you run your operation more efficiently. By using these seven functionalities, you can reduce waste, save money, and make informed decisions. Whether you’re tracking sales, managing inventory, or optimizing routes, this software has got you covered. Give it a try and see how it can help your business grow!

Technology in vending operations offers real-time sales and inventory insights, simplifies processes such as price adjustments, and boosts customer loyalty with rewards. It supports cashless payments and personalizes experiences, enhancing efficiency and satisfaction in self-service retail.

Switching to Seed from your current VMS improves business operations with better data visibility, automated processes, and expert support. Most machines can be switched remotely, making the transition smooth and efficient.

Using data from vending machines helps businesses. By using solutions like card readers and kiosks, companies can select top products, enhance efficiency, and make smart choices to boost profits and lower costs.