The 2026 Micropayment Trends Report is out, and if you operate vending, amusement, or gaming machines, there’s more in it for you than you might expect.
Cantaloupe’s annual report pulls from transaction data across 621,000 connected devices in the US and Canada — covering vending, micro markets, Smart Stores, and amusement and gaming. It’s one of the most comprehensive looks at self-service spending behavior available anywhere, and this year’s findings are particularly worth your attention.
We’ve pulled five of the most operator-relevant numbers to give you a taste of what’s inside. But the full report is where the real value is — the context, the trend graphs, and the consumer behavior data that explains not just what happened in 2025, but why, and what it signals for the year ahead.
Here’s what caught our attention.
#1: $2.45 vs. $1.57
What cashless customers spend compared to cash customers — a 59% gap
This is the single most important number in the report if you’re still on the fence about upgrading your machines to accept cashless payments.
On average, customers who pay with a card or mobile wallet spend $2.45 per vending transaction. Customers paying with cash spend $1.57. That’s not a rounding difference — that’s 59% more revenue per sale, from the same machine, in the same location.
Here’s why it happens: cash creates friction. When someone has to dig for exact change or feed crumpled bills into a reader, they’re more likely to abandon the purchase or settle for a cheaper item. Cashless removes that hesitation entirely. The customer sees what they want, taps, and walks away. No second-guessing.
What this means for you: If you have machines still running cash-only, run this calculation. Take your average daily transactions at that machine, multiply by $0.88 (the per-transaction gap), and multiply by 365. That’s your annual revenue gap — per machine — from not accepting cashless. For a cash-only machine doing 30 transactions a day, that’s nearly $9,700 a year in unrealized revenue.
#2: 78%
The share of vending sales that are now cashless — up from 73% the year before
For years, “cashless is growing” was a trend. In 2025, it became the baseline. Nearly 8 in 10 vending transactions are now cashless, and that number has climbed every single year. It isn’t slowing down.
What’s notable here isn’t just the number — it’s the direction. The 5-point jump from 73% to 78% in a single year tells you that consumer behavior has already shifted. Your customers aren’t waiting for cashless to become convenient. They’ve already made the switch. The machines that haven’t kept up are the ones creating friction.
What this means for you: If you’re still treating cashless as an upgrade, it’s time to reframe it as a baseline requirement. Audit your route. Any machine sitting below your cashless average is underperforming not because of location or product — but because of payment infrastructure. That’s a fixable problem.
#3: 85%
The share of cashless vending transactions that are contactless (tap-to-pay)
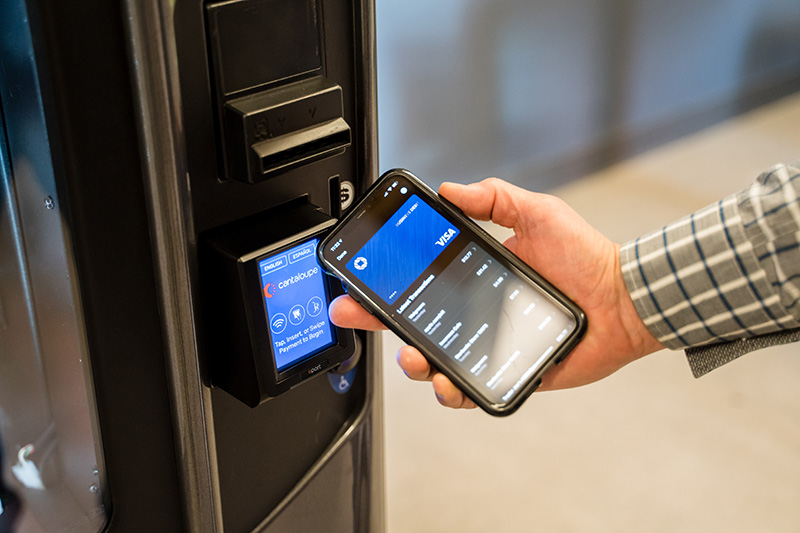
This one surprises a lot of operators. It’s not enough to accept cards anymore. The overwhelming majority of cashless customers — 85% — are tapping, not inserting or swiping. That includes both physical contactless cards and mobile wallets like Apple Pay and Google Pay.
This number jumped from 78% the year before, meaning the shift to tap-first behavior is accelerating. Consumers have been trained by their everyday retail experiences — grocery stores, coffee shops, transit — to expect tap as the default. When they walk up to a vending machine and have to insert a card, it feels dated.
What this means for you: When you’re evaluating cashless readers for your machines, contactless capability isn’t a premium feature — it’s the minimum. If your current readers don’t support tap-to-pay, you’re already behind where your customers are.
#4: $6.01 vs. $0.94
What cashless players spend compared to cash players at amusement and gaming machines — a 539% gap
If you operate amusement or gaming machines alongside your vending route, this number will stop you in your tracks. The average cashless session at an amusement or gaming machine generated $6.01 in revenue in 2025. The average cash session? Just $0.94. That’s not a typo — it’s a 539% gap between payment types.
The reason goes beyond simple spending habits. Cash is inherently disruptive to the gaming experience. Every time a player runs out of credits, they have to stop, find bills or coins, and re-engage with the machine. That interruption kills momentum — and often kills the session entirely. Cashless players don’t have that problem. They keep playing, which means they keep spending.
The data backs this up: cashless transactions represent only 37% of amusement and gaming transactions, yet they drive 79% of total revenue in the segment. A minority of payment interactions is generating the overwhelming majority of the money.
What this means for you: If your amusement or gaming machines are still cash-only or cash-primary, you’re not just leaving money on the table — you’re actively shortening your customers’ sessions. Cashless upgrades in this segment have one of the clearest ROI cases of any equipment investment you can make.
#5: +705%
The growth in Smart Store locations in a single year — from 71 to 572
This number isn’t here to alarm you. It’s here to make sure you’re paying attention to what’s happening at the edge of the industry — because it will eventually affect the center of it.
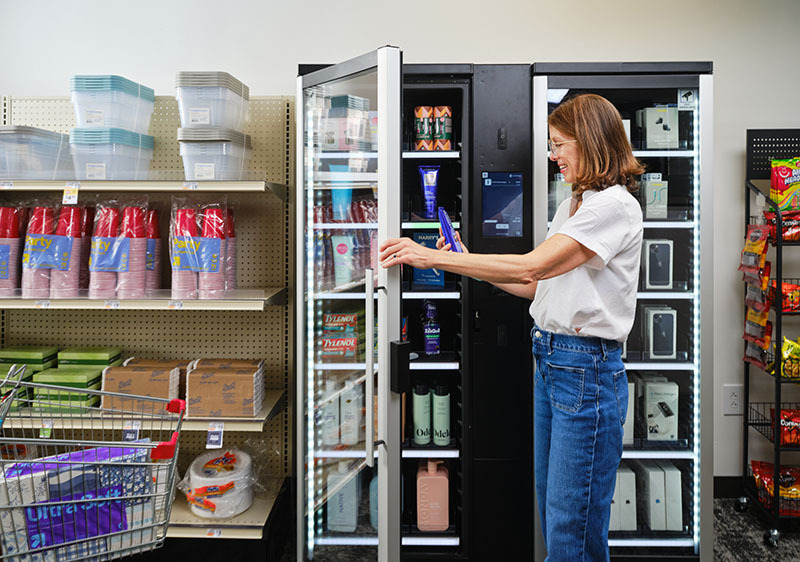
Smart Stores are fully cashless, unattended retail environments that carry a wider range of products than a traditional vending machine — fresh food, everyday essentials, grab-and-go meals. In 2025, Smart Store locations grew from 71 to 572 in a single year. That’s more than eightfold growth, and it’s the fastest expansion of any self-service format tracked in the report. They also generate the highest average ticket of any format at $4.49 — more than double the average vending transaction.
To be clear: Smart Stores aren’t replacing vending machines tomorrow. The total number of locations is still small compared to the hundreds of thousands of vending machines in the field. But the direction is significant. Operators and location partners are actively looking for higher-revenue self-service formats, and Smart Stores are proving they can deliver.

FAST FACTS
- Cashless customers spend 59% more per vending purchase than cash customers, averaging $2.45 vs. $1.57 per transaction.
- Cashless is now the norm, accounting for 78% of all vending sales—up five percentage points in just one year.
- Tap-to-pay dominates, with 85% of cashless vending purchases made using contactless cards or mobile wallets.
- Smart Stores are the fastest-growing self-service format, expanding 705% in a single year while generating the highest average ticket at $4.49 per purchase.
What this means for you: You don’t need to pivot your entire business today. But it’s worth understanding what Smart Stores offer that traditional vending doesn’t — broader product selection, a more open retail experience, and a fully cashless environment — because those are the things driving larger baskets and faster adoption. The operators who are watching this trend now will be better positioned to make decisions about their own format mix as Smart Stores continue to scale.
The Bottom Line
These five numbers are a starting point. The full 2026 Micropayment Trends Report goes deeper — with trend data by format, consumer spending context from Mastercard SpendingPulse®, and a detailed outlook for every segment of self-service retail heading into 2026.
If you want to understand where the industry is going and make smarter decisions for your operation this year, it’s worth the read.
The Cantaloupe Micropayment Trends Report 2026 breaks down the latest transaction data across self-service retail to show where the industry is headed. This year, with Consumer Context sourced from Mastercard SpendingPulse, we’re able to dissect how and where consumers are spending better than ever before.
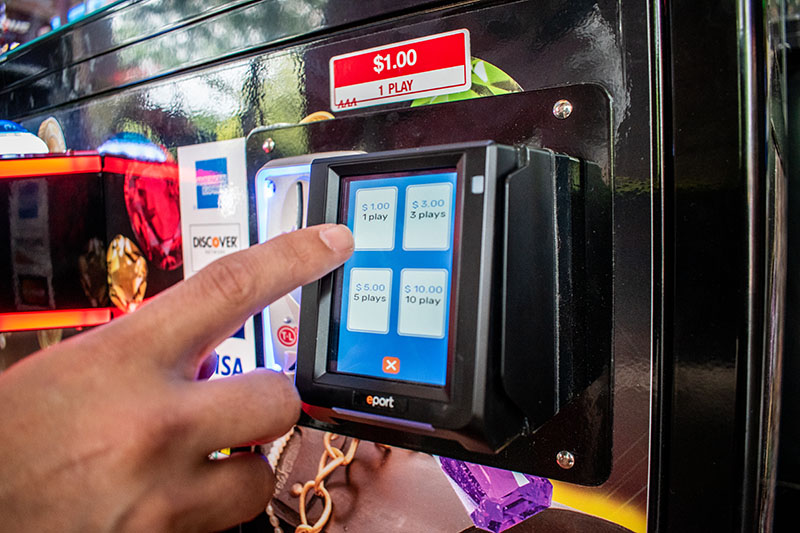
Amusement machines are quickly becoming one of the fastest-growing opportunities in self-service retail. Here, we break down the trends, payment data, and technology making it easier than ever for vending operators to add games—and unlock new revenue streams.

Canteen of Northern California’s work with a local college is a testament to the transformative power of cutting-edge retail solutions. The outcomes are impressive: substantial sales growth, more efficient inventory control, and heightened customer satisfaction. By embracing innovative technology, traditional vending operations were revolutionized, yielding exceptional results.